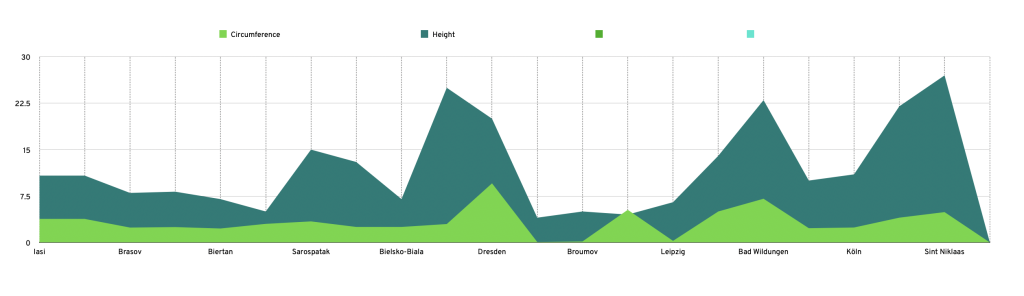
Each of our partners has not only produced creative work but they have taken measurements and data from their chosen tree – exact position, type of tree, height, diameter at 1.3 metres etc. This information has been used in two ways. Firstly, it is possible to assess each tree’s oxygen output, carbon dioxide intake, pollutants absorption, water needs and so on from this information. Secondly, I have chosen to frame the structure of the music on the specific measurements of the trees as the journey unfolds. So the image below does not represent the mountains on the journey thankfully, it represents the peaks and troughs of the chosen trees’ data and hence the tension/resolution, density aspects of the music as it progresses over its 55 minute span.
R3GIS are collating the information from each of the trees and that will be displayed on the website soon.